update.packages(checkBuilt = TRUE, ask = FALSE)In-class Exercise 3
Installing and loading R packages
Two packages will be installed and loaded. They are: tidyverse and ggiraph
pacman::p_load(ggiraph, tidyverse)Importing data
exam_data <- read_csv("data/Exam_data.csv")ggplot(data=exam_data, #gives you a blank data frame
aes(x = MATHS)) + #aesthetic mapping refers to the data column or field you want to plot
geom_dotplot(dotsize = 0.5)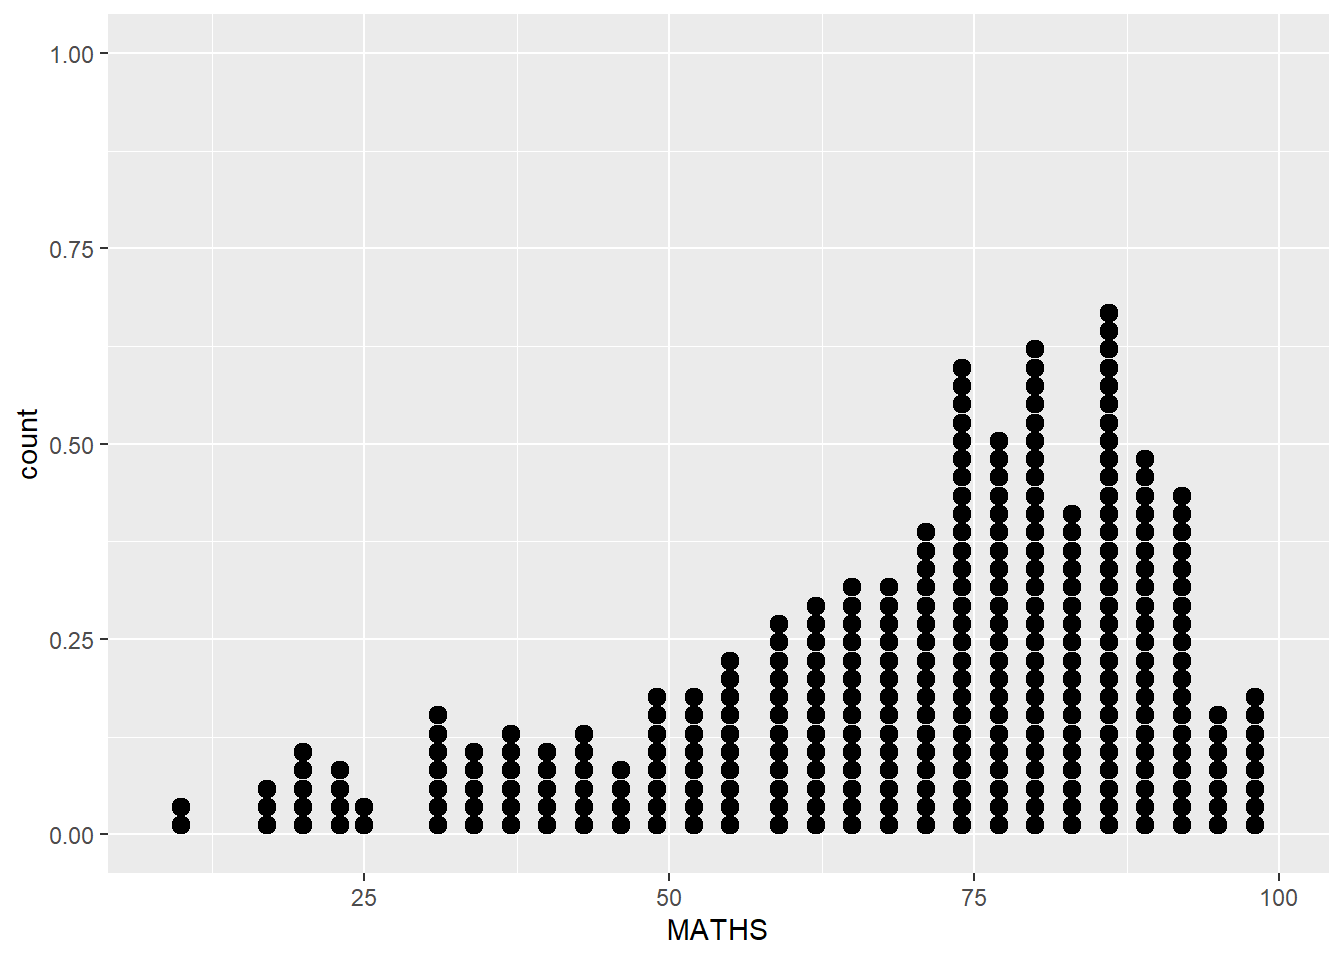
p <- ggplot(data=exam_data,
       aes(x = MATHS)) +
  geom_dotplot_interactive(
    aes(tooltip = ID),
    stackgroups = TRUE,
    binwidth = 1,
    method = "histodot") +
  scale_y_continuous(NULL,
                     breaks = NULL)
girafe(
  ggobj = p,
  width_svg = 6,
  height_svg = 6*0.618
)